Circulation and Mixing of the Hudson River Plume
In this work, we used data from the Lagrangian Transport and Transformation Experiment (LaTTE) conducted between 2004-2006, which focused on the discharge from the Hudson River onto the Mid-Atlantic Bight shelf. This data set captured in high-resolution the passage of the “nose” or leading edge of the Hudson River plume by a mooring array, which provided us with detailed two-dimensional information about the circulation within the plume.
The plume outflow was characterized by a two-layer bulge-like feature but became continuously stratified and vertically sheared in the far field, where Richardson numbers are generally below 0.5. High-frequency velocity and backscatter data from a moored ADCP revealed strong vertical and horizontal oscillatory motions at the front with a wavelength approximately 7–8 times the plume thickness, consistent with Kelvin-Helmholtz instabilities. These motions quickly died out after 2–3 cycles.
The combination of vertical shear and stratification in the plume leads to a buoyancy flux toward the nose of the plume, which competes with mixing. However, the continued salinity increase of the plume as it propagated downshelf indicates that mixing overcomes this delivery of freshwater to the plume front. Based on those observations we developed a simple 2D model that relates the time rate-of-change of the plume salinity to (1) salt entrainment due to vertical mixing, and (2) freshwater flux and salt removal due to the vertical shear of the stratified plume.
Estimates of an entrainment coefficient from this model are consistent with previous estimates from the near field of a river outflow. A scaling of the plume width is obtained by assuming that vertical shears are controlled by both thermal wind and a critical Richardson number. This scaling yields plume widths that are consistent with previous laboratory studies.
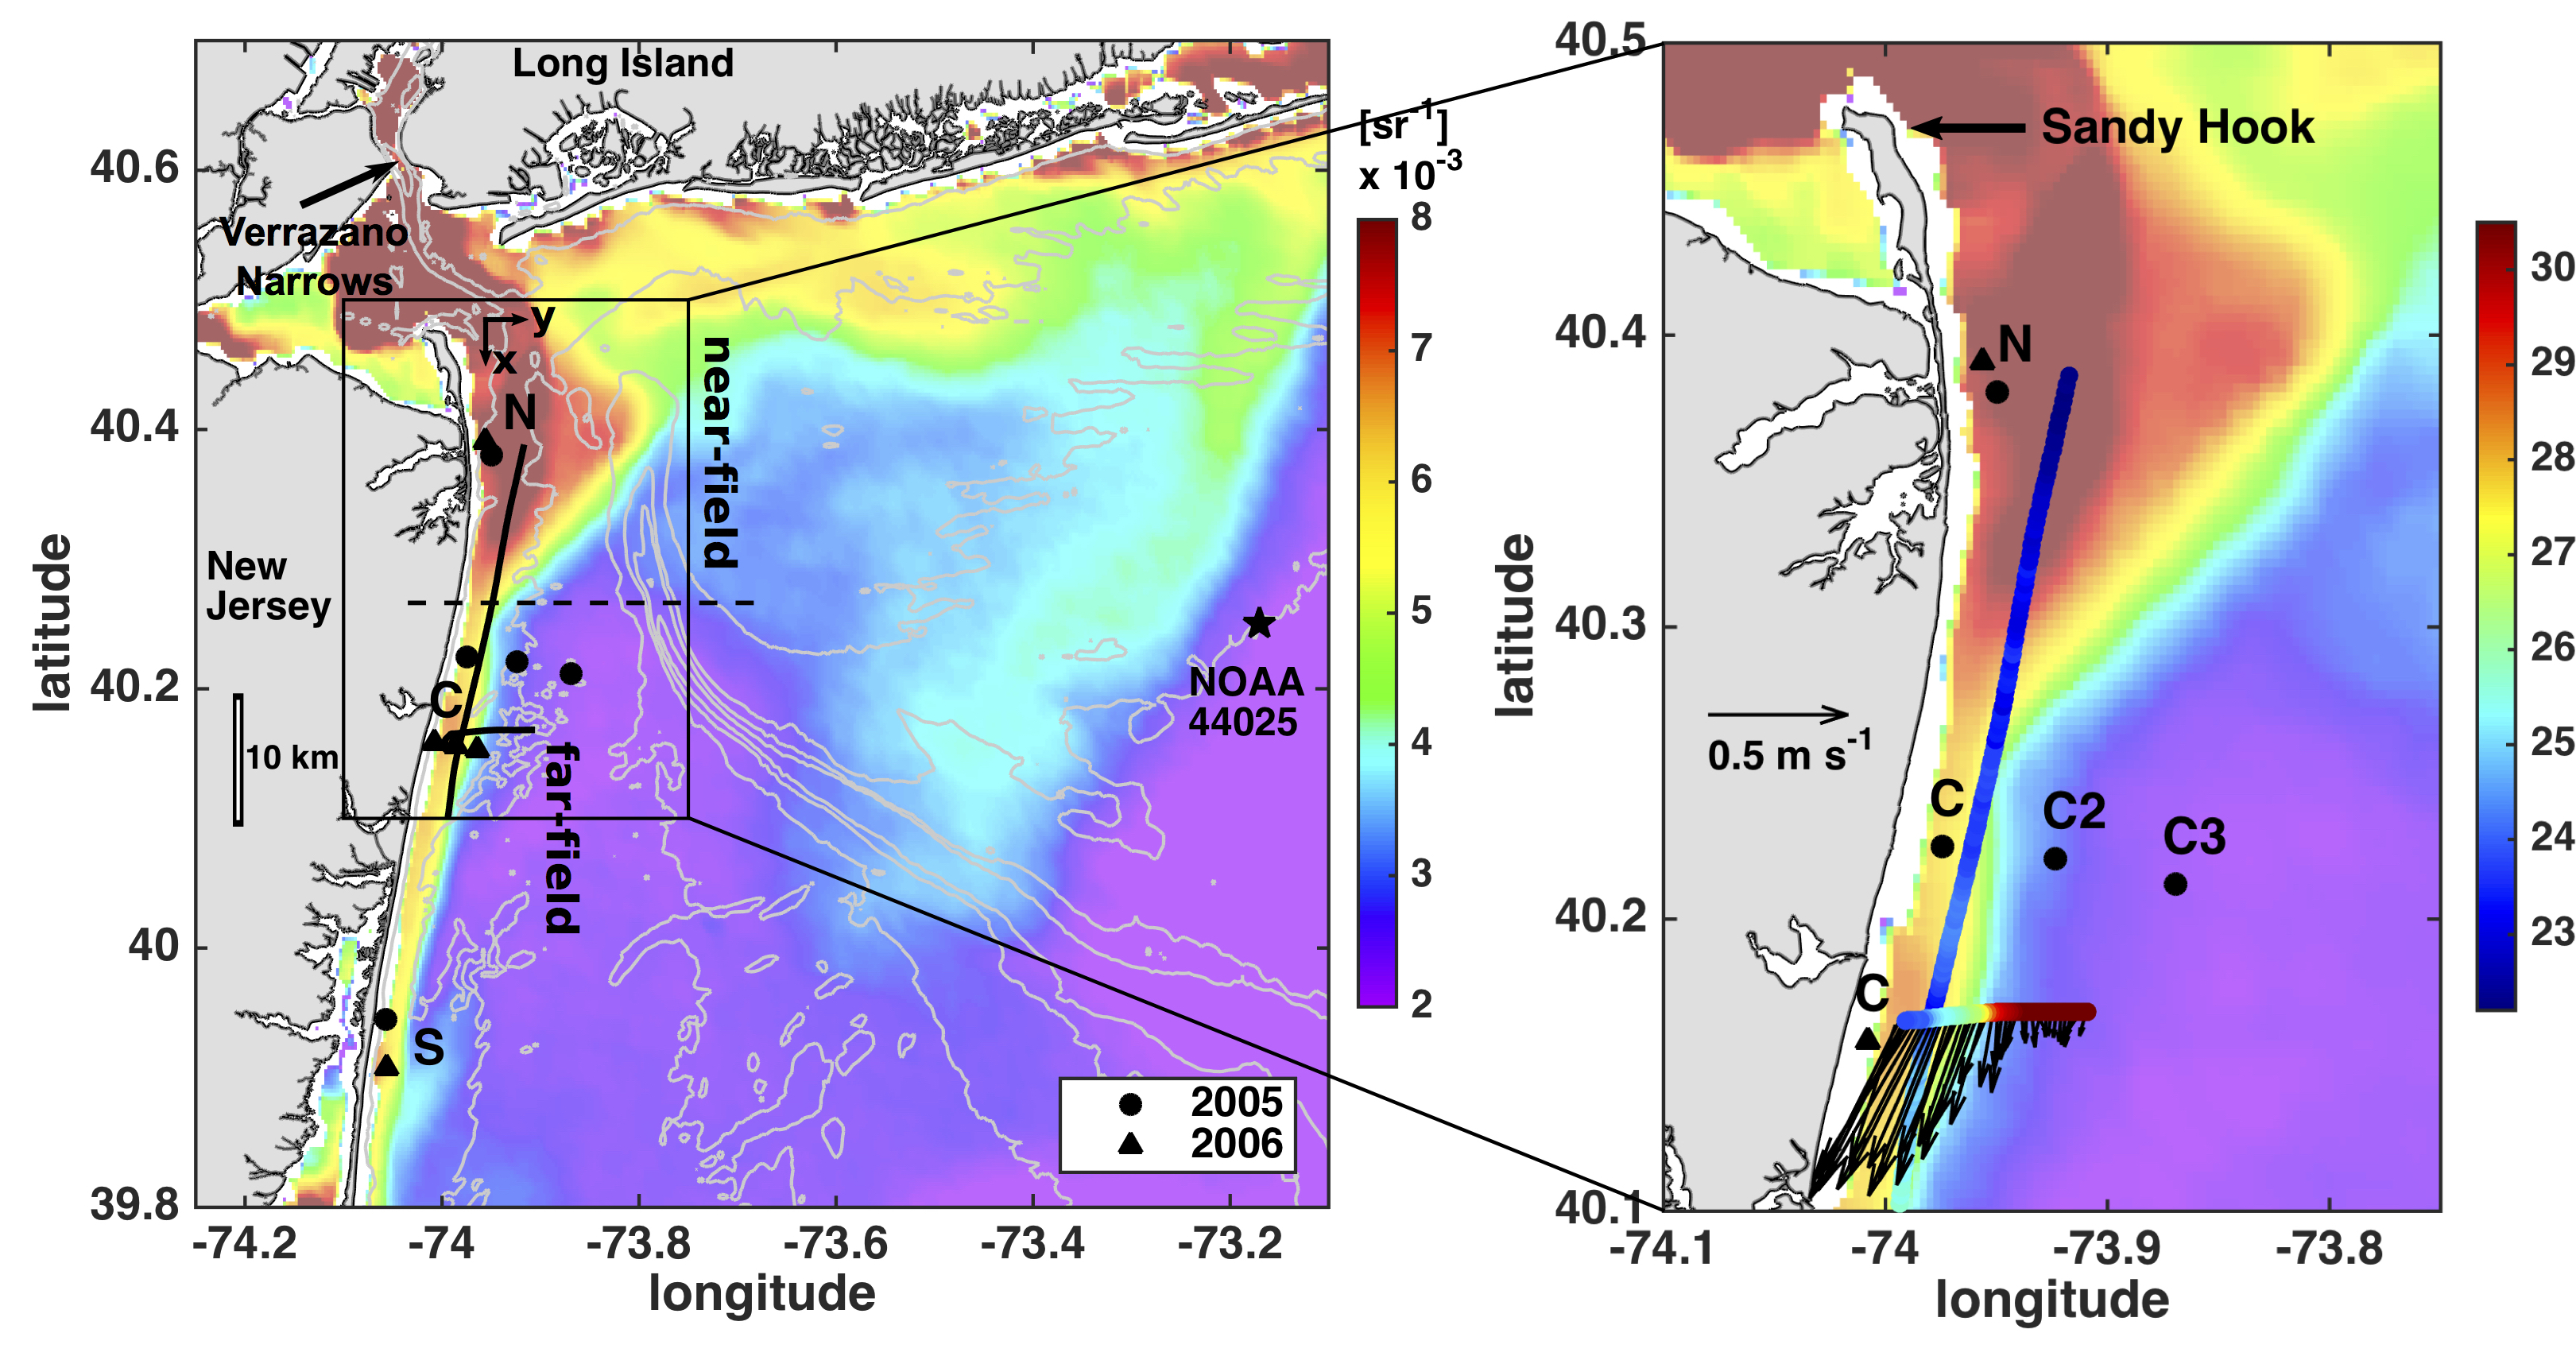
(left) Study area overlayed by a satellite image from MODIS/Terra from 9 April 2005, showing the 555 nm wavelength remote sensing reflectance, an effective tracer of turbidity and colored dissolved organic matter in the water column, hence indicative of river plumes. The Hudson River plume is apparent along the New Jersey coast by regions of warm colors. A dashed line separates the near-field (bulge) and far-field (coastal current) regions of the plume (right) Zoom in the region indicated by the box on the left plot, with surface salinity and velocity vectors along the ship track from 10 April 2005.
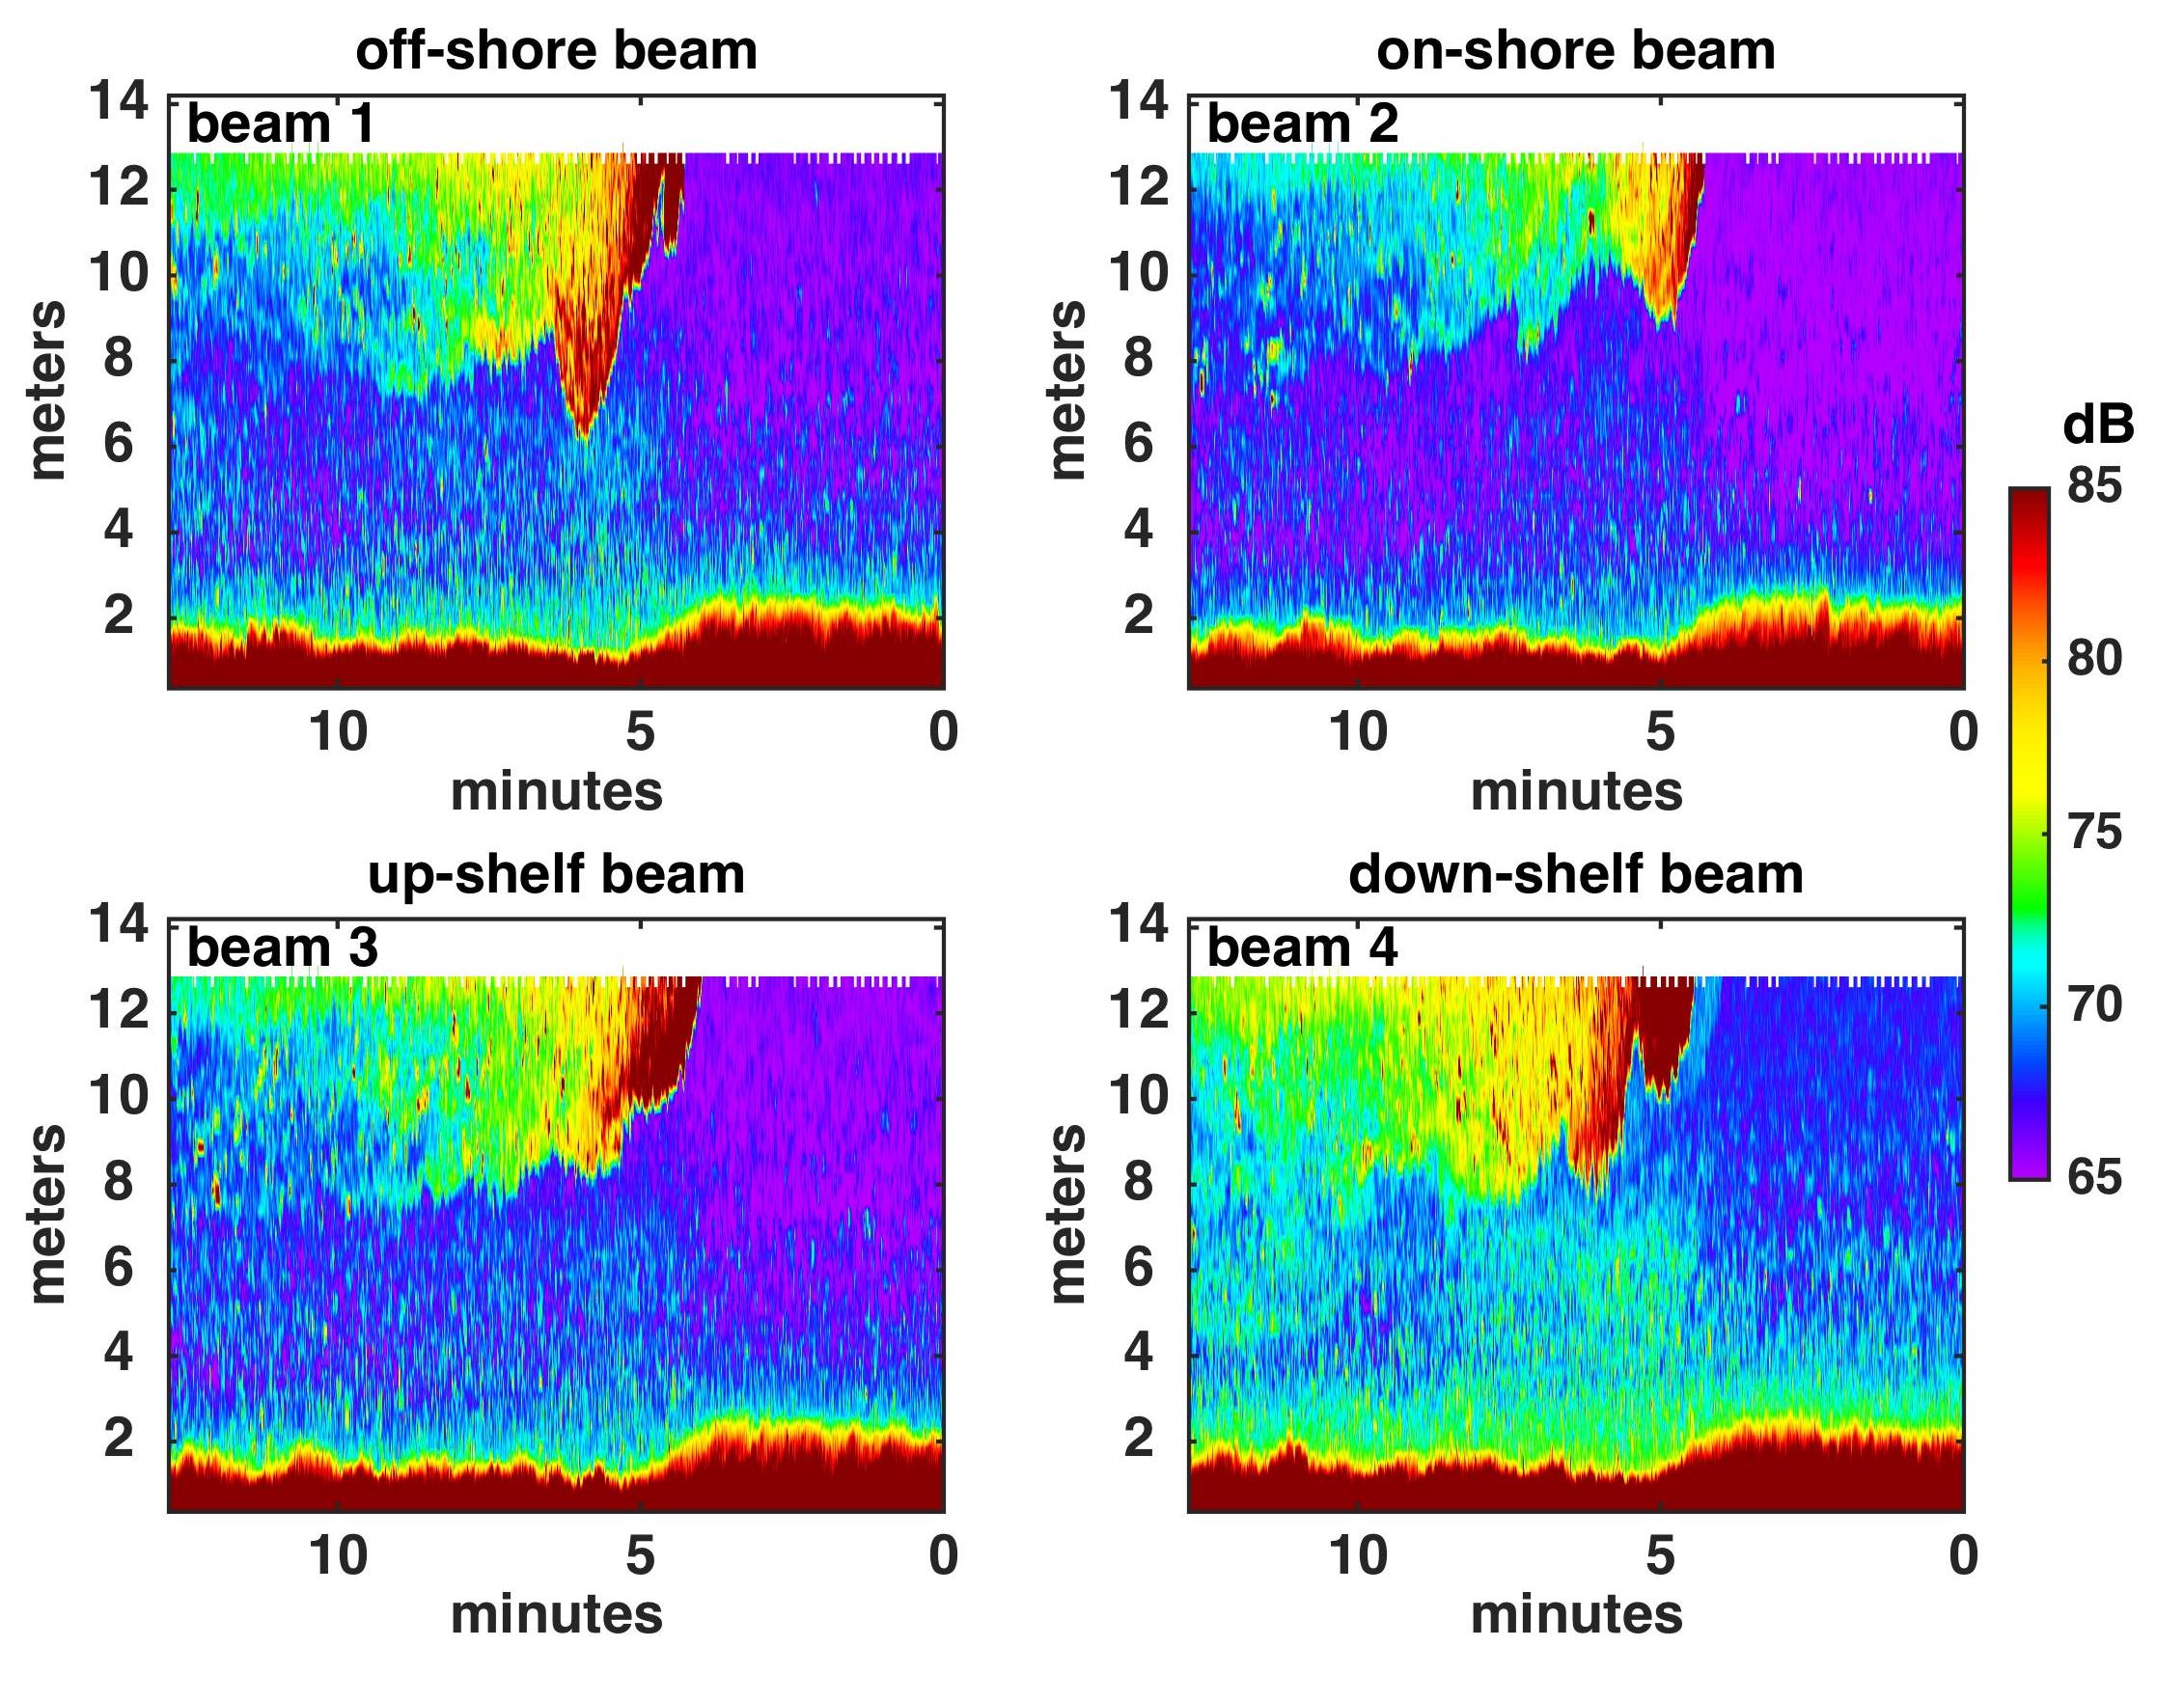
Acoustic backscatter from the four beams at the C mooring during 14 April 2006 frontal passage. Four plots show (clockwise from top left) offshore directed beam, onshore directed beam, down-shelf directed beam, and up-shelf directed beam.
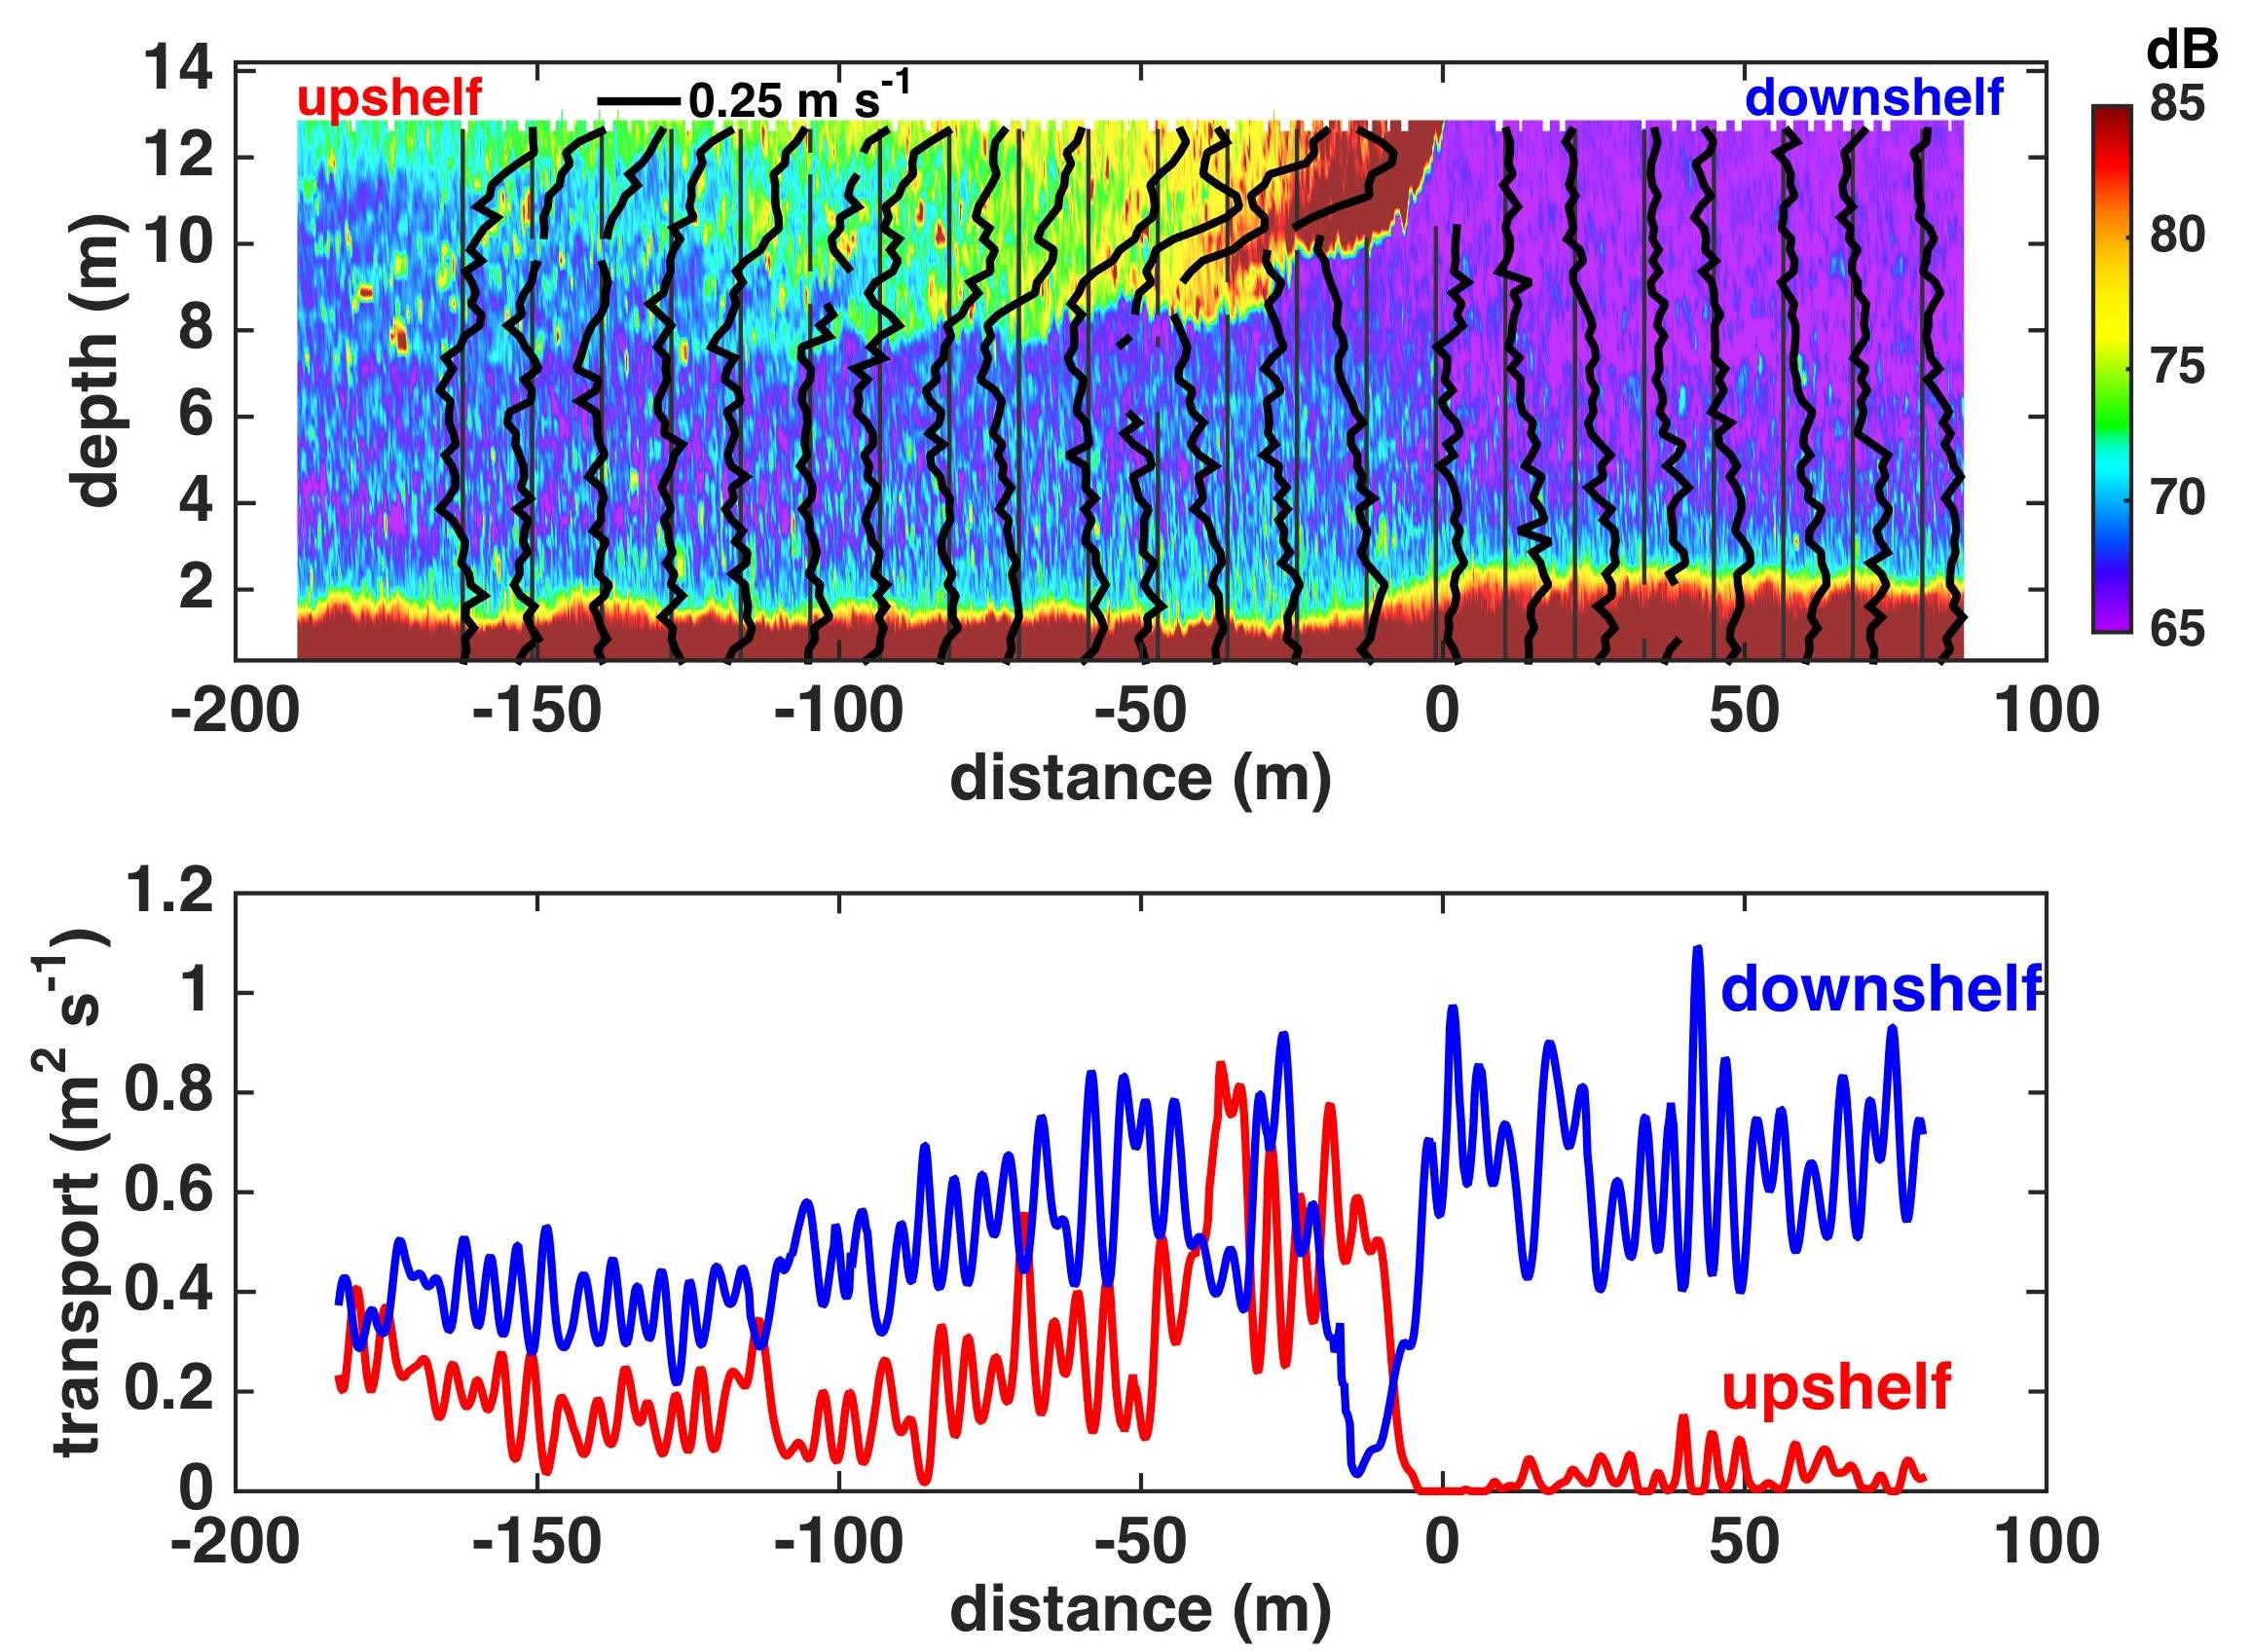
(top) Acoustic backscatter (color) and along-shelf velocity (profiles) during frontal passage through mooring C, on 14 April 2006. X axis is distance based on frontal speed (0.34 \(m s^{-1}\)). Velocity profiles are relative to earth with the thin gray lines zero and are spaced 0.25 \(m s^{-1}\) apart. (bottom) Up-shelf transport (red) and down-shelf transport (blue) in \(m^2s^{-1}\) .
Publication:
- Mazzini, P.L.F. and Chant, R.J. Two-dimensional circulation and mixing in the far field of a surface-advected river plume. 2016. Journal of Geophysical Research: Oceans, 121, 3757-3776. [JGR]